Share
The U.S. Pet Goods & Services sector is indeed approaching a 'new normal' as it stabilizes following the notable growth surge propelled by the Covid-19 pandemic.
At Stax, our ongoing work within Pet Goods & Services has given us a front-row seat to witness the market’s evolution. In this article, we discuss market growth trends, shifts in consumer preferences and vendor dynamics, which give rise to a fresh landscape of potential growth opportunities for both businesses and investors.
Market Growth Trends by Segment
1. Pet Foods and Treats
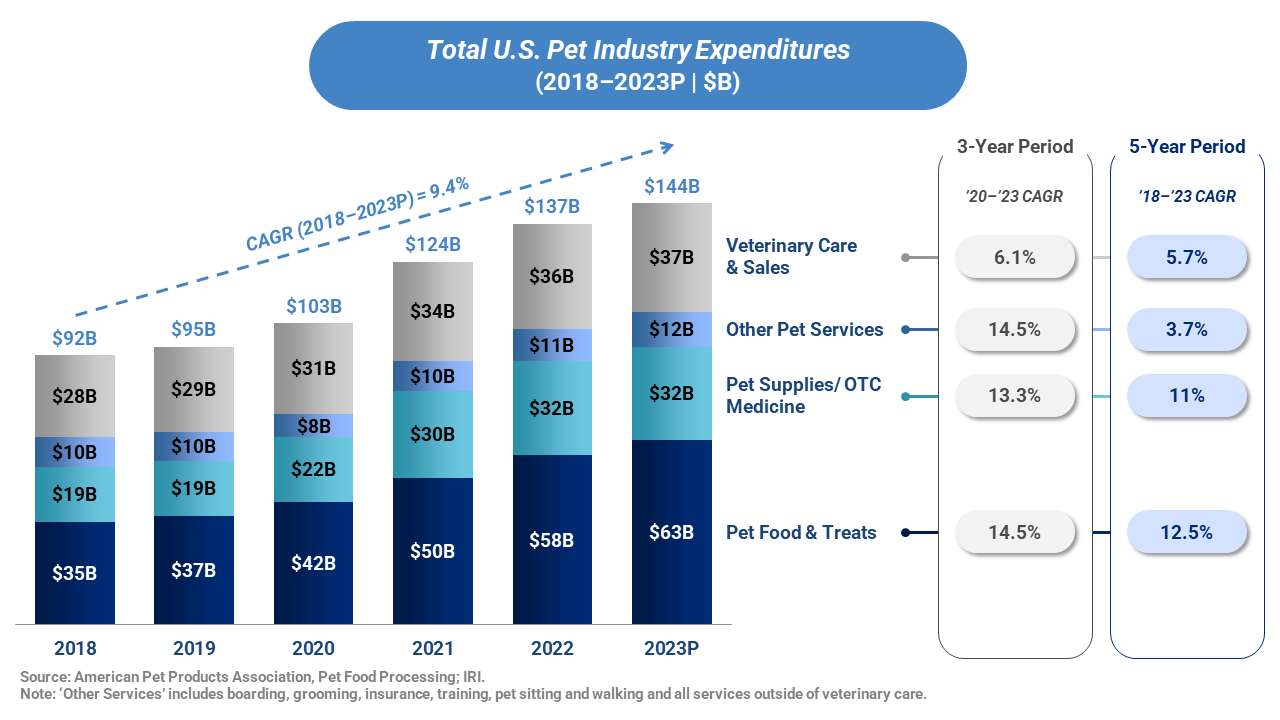
The pet food and treats market accounts for the largest share of U.S. pet expenditures, at 44% of total pet spending. Overall spend on pet food and treats has grown by 12.5% p.a. over the last 5 years (2018-2023P), achieving higher growth than all other pet categories.
2. Pet Supplies and Over-the-Counter Medicine
Similarly, the pet supplies and OTC medicine market has experienced strong growth over the last five years (11% CAGR) largely driven by the increase in pet ownership and the humanization of pets.
3. Pet Services
During Covid, the need for in-person pet services dropped off (boarding, grooming, walking), due largely to social distancing and growth in the remote workforce, leading to a sharp contraction in services expenditures from 2019 to 2020 (by 20% YoY).
However, post-pandemic return to office, increased emphasis on pet health and wellbeing, and the return of travel (including needs for extended boarding/pet care services) have driven strong growth resurgence and will continue to drive growth in near-term.
4. Veterinary Care Services
Spend on veterinary care services has seen the most stable growth over time compared to other pet categories, as it’s considered non-discretionary spending. The category will continue to benefit from underlying trends in pet ownership and overall consumer willingness to spend on pet goods and services.
Ongoing Shifts in Consumer Purchasing Behavior
While pet ownership has increased in recent years, this alone does not explain the significant growth in U.S. consumer expenditures on pet goods and services.
One explanation is that households are gravitating toward pets which require higher costs-of-care. From March 2020 to May 2021 alone, roughly 1 in 5 U.S. households acquired a dog or cat. The other core contributing factor has been the growing humanization of pets.
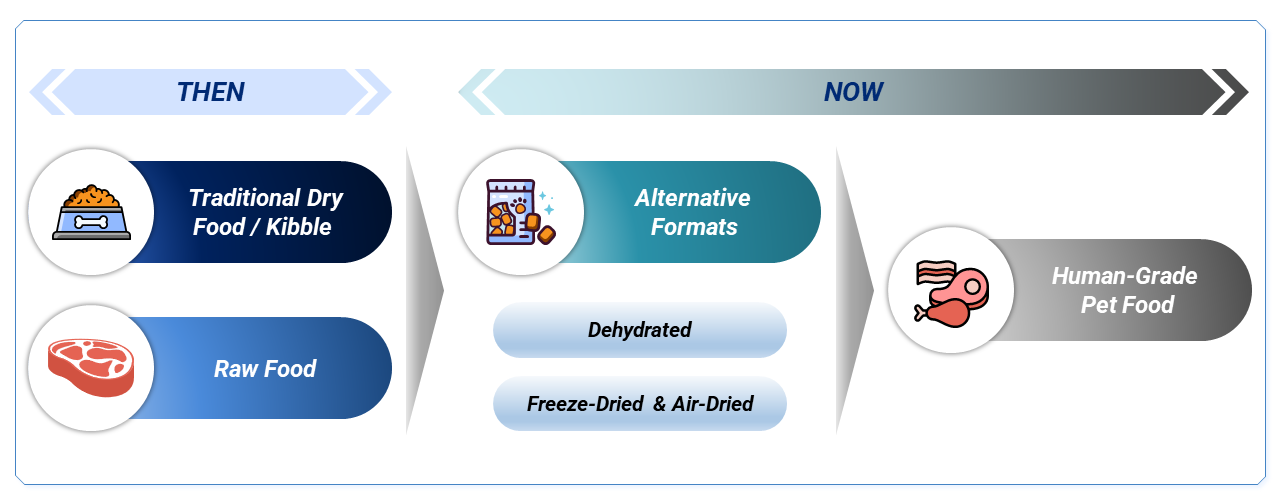
This has especially played out in the pet foods & treats category, where demand for alternative formats and, more recently, human-grade pet food has outpaced demand for traditional pet food modalities (e.g., kibble).
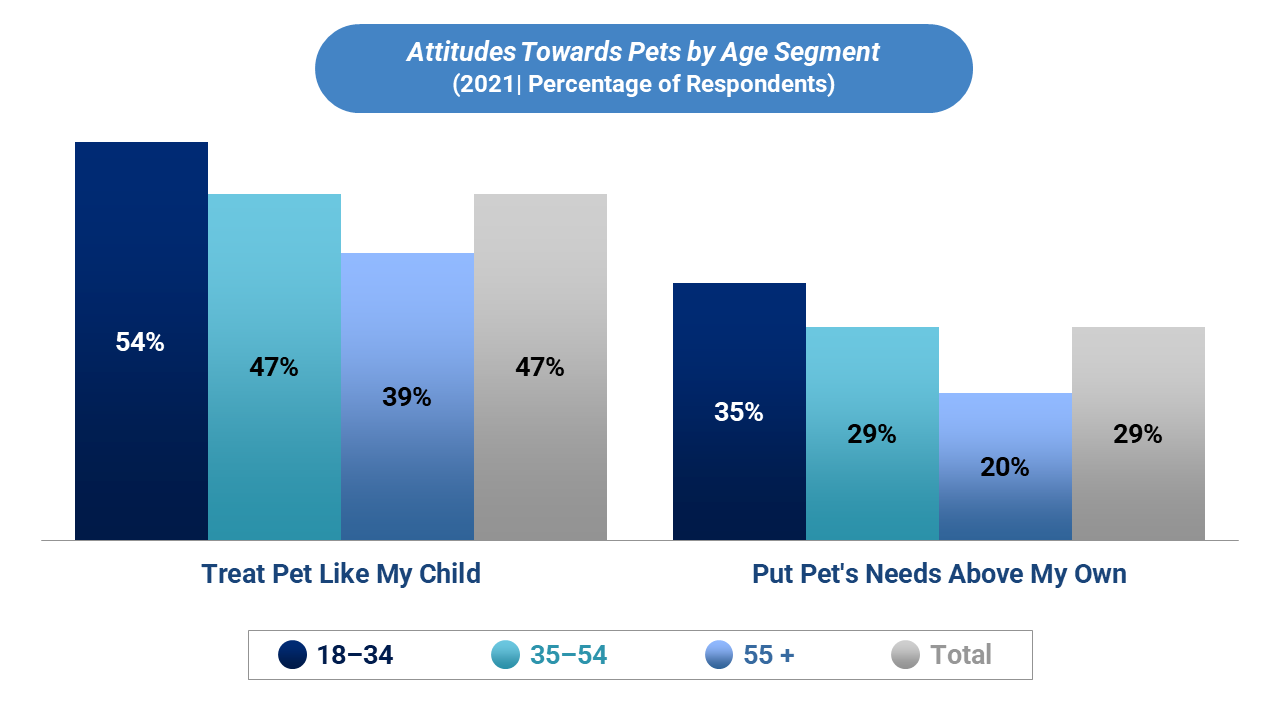
Rising owner willingness to spend on pets is indicative of the increased humanization of pets and a larger focus on pet health/wellbeing. Younger generations of pet owners are most likely to spend more on pet services, with 54% of 18–34-year-olds noting they treat pets like a child, while overall 29% of owners note putting pet needs above their own.
Approximately 60% of pet owners surveyed across several large markets indicated using grooming services in the last 6 months. Daycare, pet walking, pet training, nutrition services, and behavior/education services were also notably used among owners, evidencing consistent demand for various pet services.
Vendor Dynamics
Currently there are a wide range of business models that exist among pet goods and services providers, each providing their own approach to addressing different consumer needs.
In recent years, non-pet retailers have expanded into the pet services market to address the growing needs of pet owners. Examples include Tractor Supply Co (partner examples include Wag!, PetVet, etc.), Walmart (partners include Rover, Pawp, Petplan, etc.), HEB (partners include Vanguard Veterinary Associates, Prudent Pet, etc.), and Lowe’s (partnered with Petco).
In addition to this need, the rising awareness of pet health & wellness among owners has culminated in growing demand for services such as dog walking, health check-ups, and pet spas that use premium, sustainable, skin-friendly products.
Pet owners are increasingly willing to spend on premium and luxury products for their pets, such as spa services, luxury grooming, luxury boarding at pet hotels, etc., driven by underlying pet humanization trends:
- 45% of American pet owners spend the same amount of money or more on the healthcare needs of their pets as they do on themselves.
- The global pet hotel market was valued at ~$4.3B in 2022 and is expected to grow by ~8.4% to a record ~$9.7B by 2023; the U.S. is estimated to hold over half (58%) of this market share. In the U.S., pet boarding costs an average of $40 per night, with luxury accommodation costing ~$80+.
- In the U.S., pet owners spend between $70-$80 on one dog grooming session, on average, and two-thirds of pet owners know that regular grooming contributes to a healthier pet.
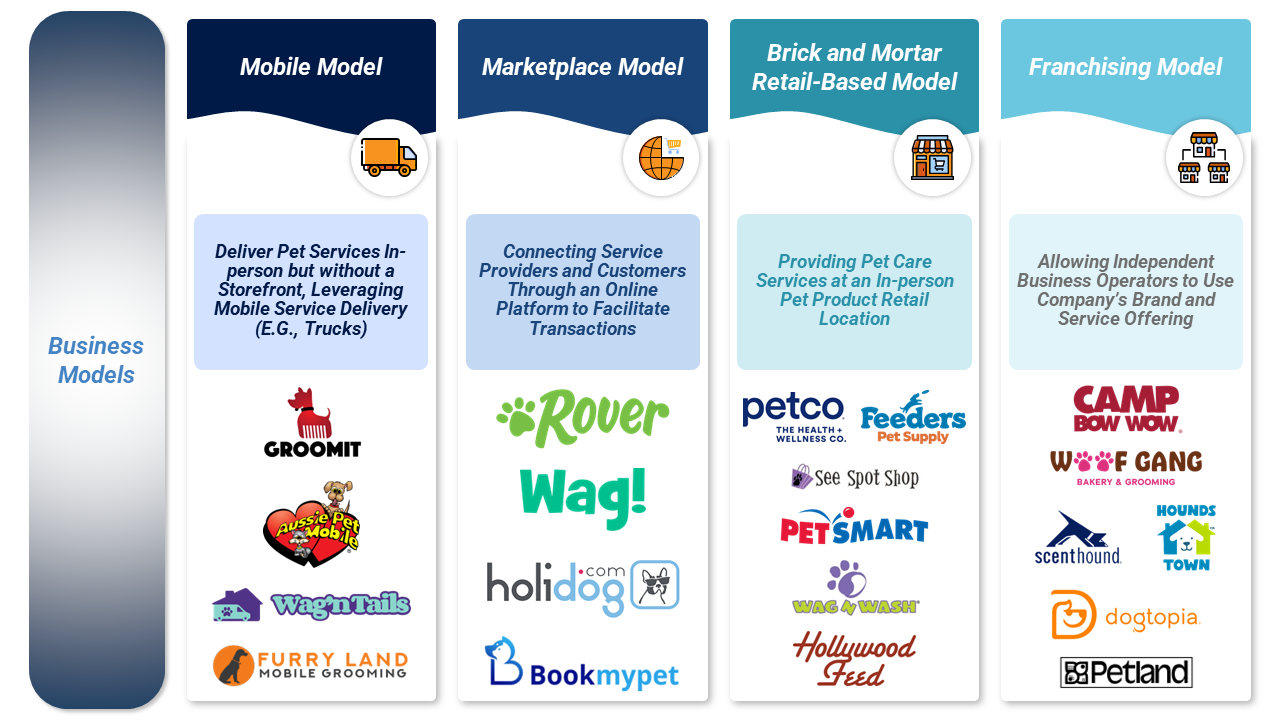
This demand has created an opportunity for companies to provide these much-needed services to a vast number of pet owners in their respective communities through a variety of business models:
1. Mobile Model— Deliver pet services in-person but without a storefront, leveraging mobile service delivery (e.g., trucks)
- Groomit, Aussie Pet Mobile, Wag’n Tails, Furry Land Mobile Grooming
2. Markteplace Model— Connecting service providers and customers through an online platform to facilitate transactions
- Rover, Wag!, Holidog.com, Bookmypet
3. Brick and Mortar Retail-Based Model— Providing pet care services at an in-person pet product retail location
- Petco, Feeders Pet Supply, PetSmart, See Spot Shop, Hollywood Feed, Wag 4 Wash
4. Franchising Model— Allowing independent business operators to use company’s brand and service offering
- Camp Bow Wow, Woof Gang, Scenthound, Hounds Town, Petland, Dogtopia
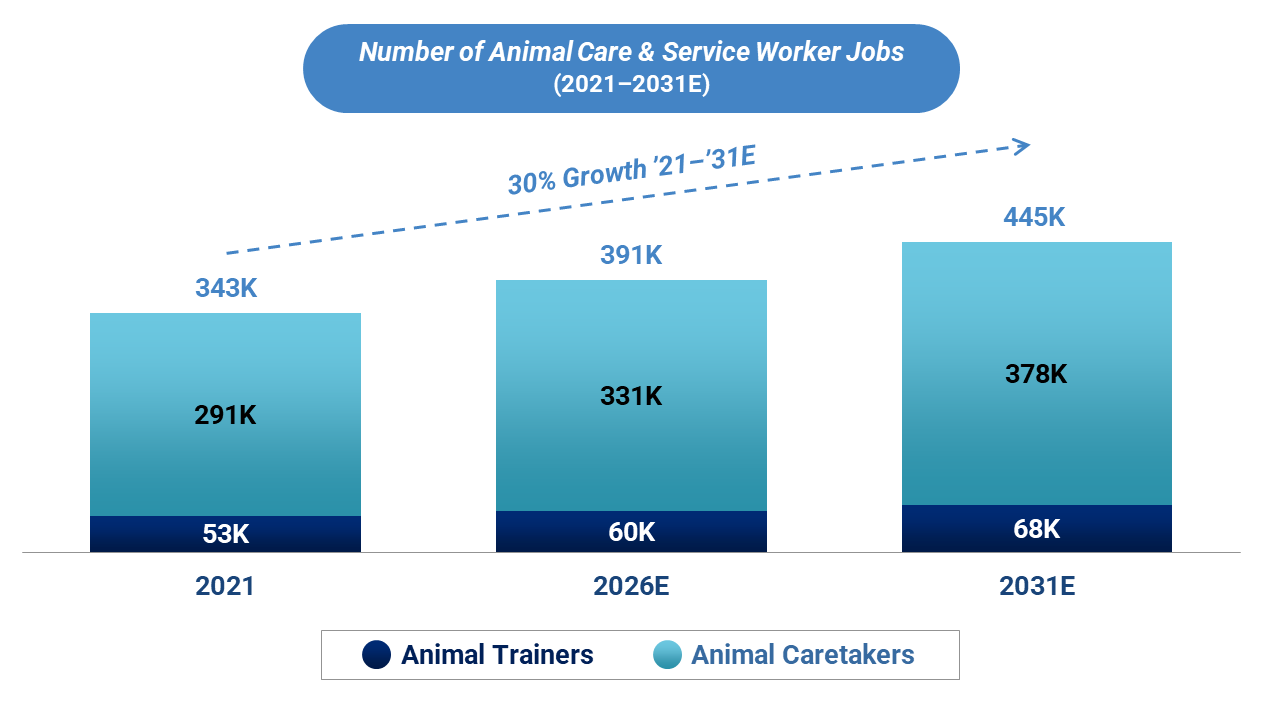
Lastly, the increasing humanization of pets and focus on health and well-being have led to a substantial growth in demand for pet services, creating new jobs for animal care & service workers. Animal care and service jobs, including animal trainers and caretakers, are expected to grow ~29% from ‘21-’31E, implying ~10k new jobs created annually to keep up with rising pet services needs.
Deal Markets & Trends
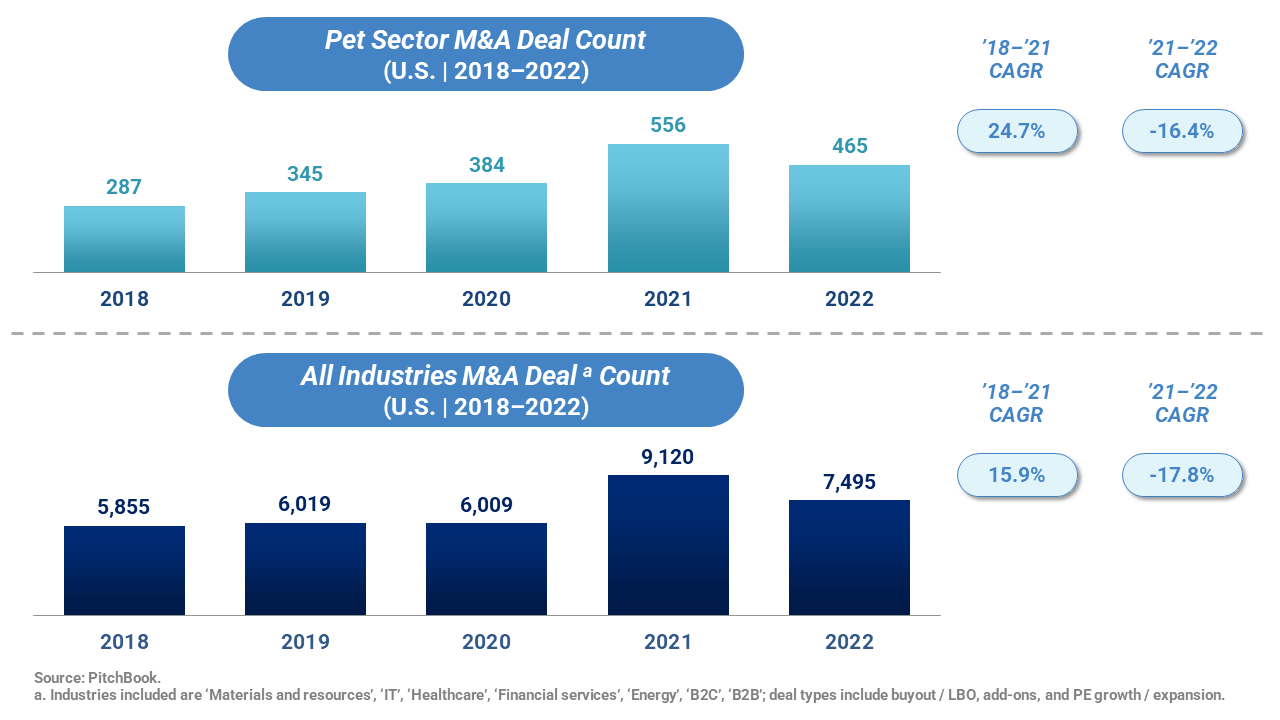
While deal activity in the pet space did decline in 2022, the impact was less substantial relative to the total deal activity in the U.S. Among pet sector deals, those in the veterinary services and pet food subsegments were most prevalent in 2022. According to Pitchbook data, 208 deals were related to veterinary services and 192 were related to pet food.
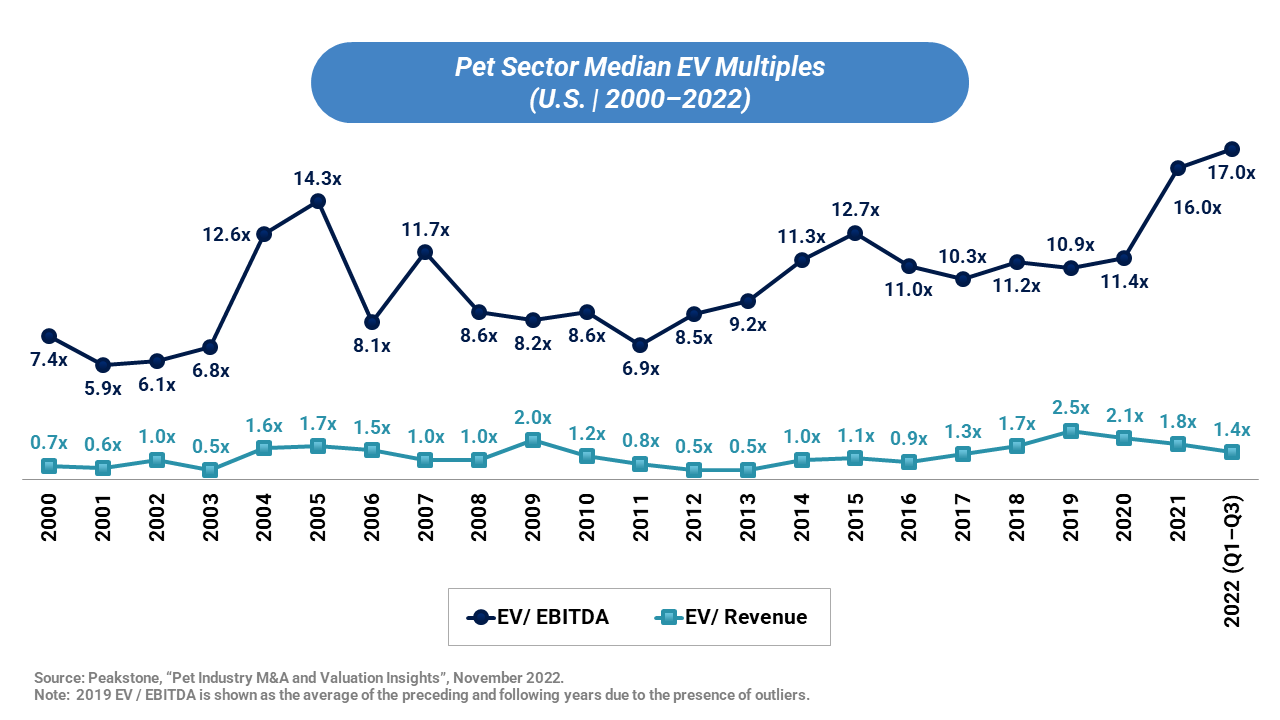
Further, median EV/EBITDA multiples for pet sector deals in the U.S. have experienced significant growth since Covid and have reached all-time highs in 2022 at ~17x EBITDA multiples. This recent spike suggests that investors are valuing assets at higher multiples without seeing elevated EBITDA figures.
Investment Perspectives
In an uncertain economic environment, investors are seeking to understand how consumer spending behaviors may change during a recession. Spending on pet products and services has sustained its growth through recent prior recessions (Covid, 2008, 2001), and growing humanization of pets and deep brand loyalty further insulates spending going forward.
2022 largely represents a normalized demand year post-Covid and can be viewed as a new baseline off which to forecast steadier growth. However, given global supply chain disruptions, supply and demand continue to be out of balance in many cases, with sales data often understating true consumer demand as a result of inventory shortages.
Post-Covid, spending at brick-and-mortar retailers is growing as consumers adopt an omnichannel approach to purchasing. In the pet space specifically, channel preferences differ across sub-categories, with brick-and-mortar spend remaining durable particularly when purchases can be integrated with a larger basket (e.g., pet food from the grocery store).
Conclusion
Overall, pet ownership and the increased wave of humanization for those pets has spurred growth in the market despite recessionary concerns and Covid-related supply issues. We anticipate this trend to continue given the quality-of-care younger pet owners are seeking. Stax will continue to observe the pet products and services markets and provide updates as market changes occur to keep our clients and readers in the know. To learn more about Stax and the services we offer, visit www.stax.com or click here to contact us.

Read More