Grant Thornton Stax Consumer group recently conducted a survey to better understand consumer sentiment and near-term spending expectations; capturing a representative sample of 1,626 respondents from across the United States, each responding on behalf of their household. The survey was fielded from April 22 to May 3, 2025. To ensure the results accurately reflect the broader US population, the sample was weighted to account for key demographic factors, including age, income, and gender, based on recent national census data. This approach ensures the findings are representative of the US population.
Highlighted below are a
series of key takeaways identified as a resulted of the survey:
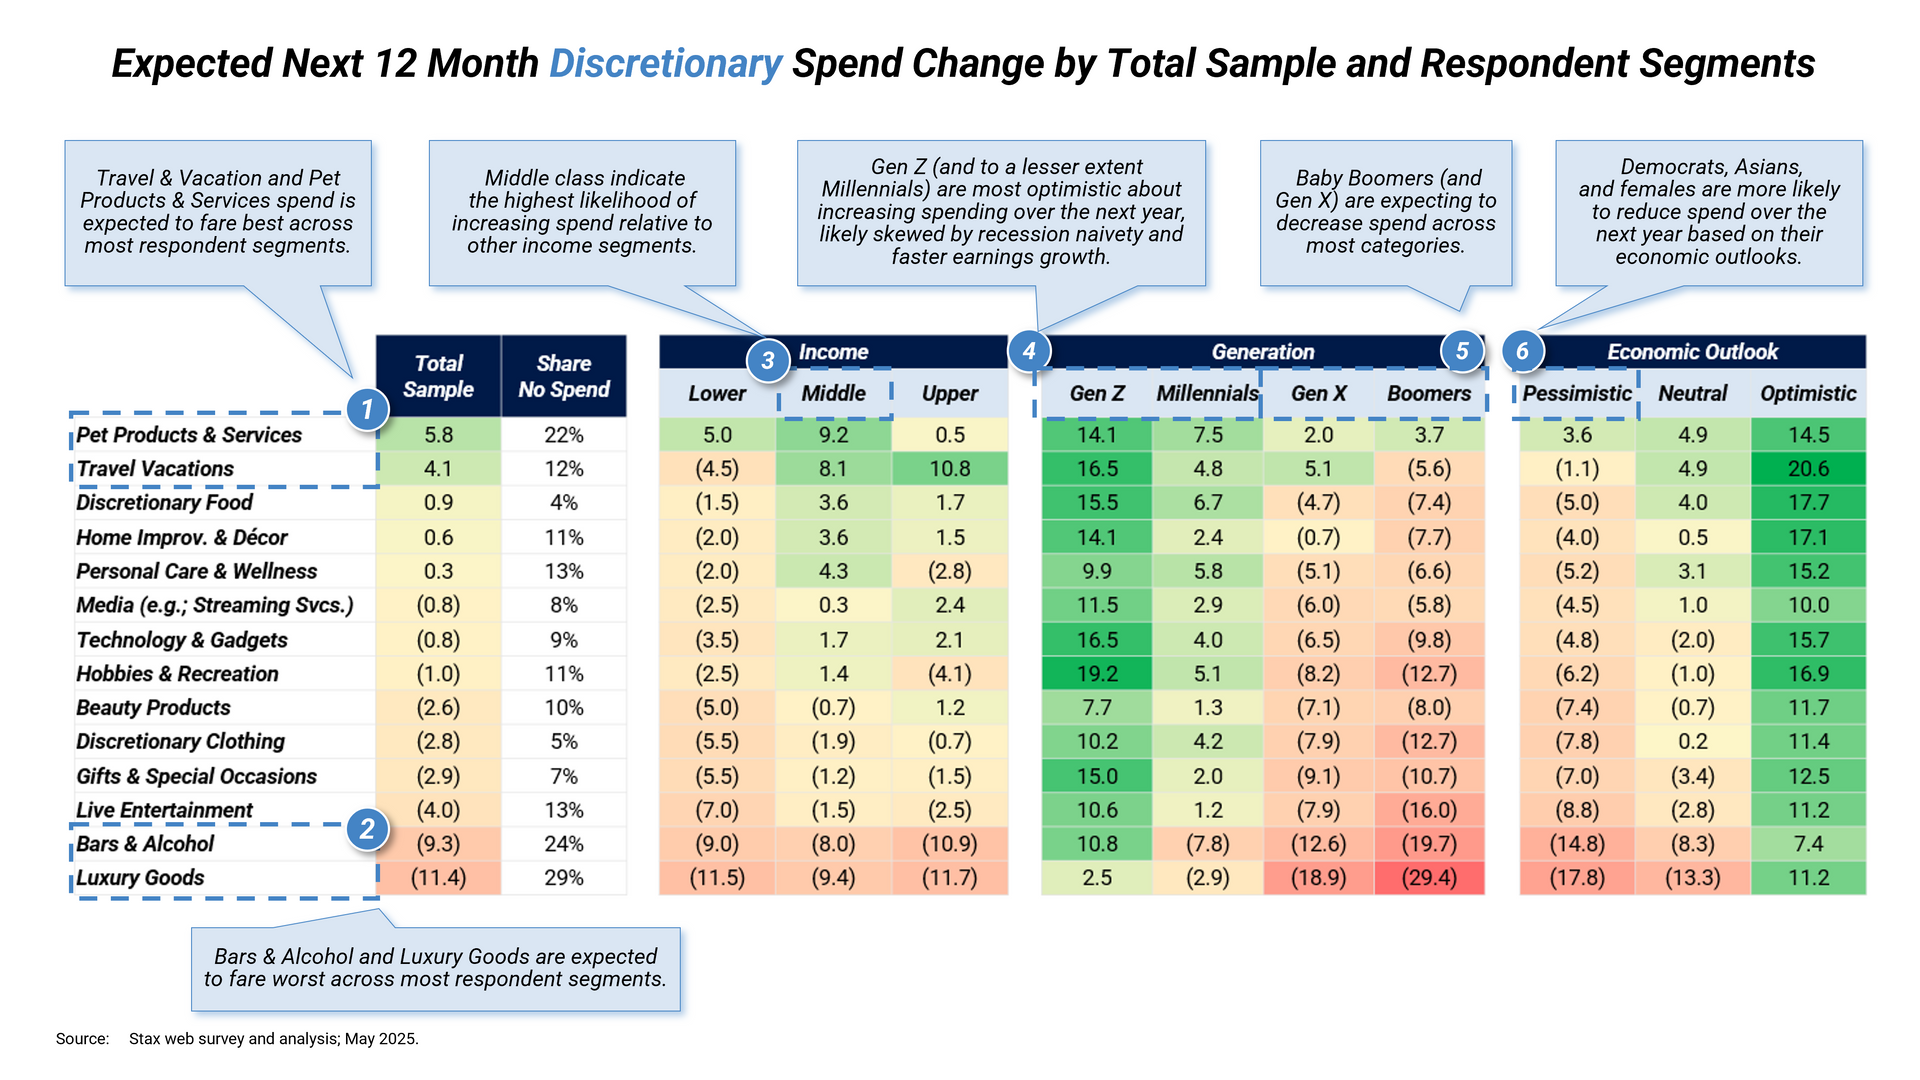
1. Pet Products & Services and Travel & Vacation spending are expected to fare best across most demographic segments, with respondents indicating increased income and lifestyle changes (especially among Gen Z and Millennials) being top factors underscoring their ability to do so.
2. Bars & Alcohol and Luxury Goods are projected to see the greatest net declines in consumer spending across most respondent segments. The former reflects a broader shift toward reduced alcohol consumption, particularly among younger, health-conscious demographics. The latter is likely a consequence of sustained inflation and economic pessimism, limiting consumer willingness to splurge on large purchases.
3. The middle class reports the largest net increase in spending, driven by expectations of higher future earnings and lifestyle changes. Still, in the near-term, ~70% are delaying purchases across certain categories to some extent given expectations for the U.S. economy; conversely, ~50% are making early purchases across at least one category, aiming to stay ahead of anticipated inflation (e.g., due to tariffs).
4.
Gen Z and Millennials are the most likely to increase spending in the next year, especially on travel and food. This is driven by income growth and lifestyle shifts. While ~50% are making early purchases (mainly electronics and vehicles) to stay ahead of rising prices, ~60% are delaying spend across at least one category due to inflation, recession fears, and rising debt. Notably, ~44% report being unaffected or unsure about the impact of market volatility, suggesting mixed sensitivity to broader economic conditions.
5.
Gen X and Baby Boomers are expected to reduce spending across most categories, except pet products, driven by inflation and economic uncertainty. While ~30% are making early purchases to avoid price hikes or supply issues, ~50% are delaying spend, with 40% citing market volatility. Still, ~40% say market conditions don’t affect their decisions, and ~20-25% are waiting for more stability before making large purchases.
6.
Economic pessimism spans demographic segments, but is most pronounced among Asians, Democrats, and females. Inflation and trade tensions are key concerns. Pessimistic segments are also more likely to cut back on spending across categories relative to neutral/optimistic consumers.
1. Pet Products & Services and Travel & Vacation spending are expected to fare best across most demographic segments, with respondents indicating increased income and lifestyle changes (especially among Gen Z and Millennials) being top factors underscoring their ability to increase spending.
2. Bars & Alcohol and Luxury Goods are projected to see the greatest net declines in consumer spending across most respondent segments. The former reflects a broader shift toward reduced alcohol consumption, particularly among younger, health-conscious demographics. The latter is likely a consequence of sustained inflation and economic pessimism, limiting consumer willingness to splurge on large purchases.
3. The middle class reports the largest net increase in expected spending,
driven by expectations of higher future earnings and lifestyle changes. Still, in the near-term, ~70% are delaying purchases across certain categories to some extent given expectations for the U.S. economy; conversely, ~50% are making early purchases across at least one category, aiming to stay ahead of anticipated inflation (e.g., due to tariffs).
4. Gen Z and Millennials are the most likely to increase spending in the next year,
especially on travel and food. This is driven by income growth and lifestyle shifts. While ~50% are making early purchases (mainly electronics and vehicles) to stay ahead of rising prices, ~60% are delaying spend across at least one category due to inflation, recession fears, and rising debt. Notably, ~44% report being unaffected or unsure about the impact of stock market volatility, suggesting mixed sensitivity to broader economic conditions.
5. Gen X and Baby Boomers are expected to reduce spending across most categories,
except pet products, driven by inflation and economic uncertainty. While ~30% are making early purchases to avoid price hikes or supply issues, ~50% are delaying spend, with 40% citing market volatility. Still, ~40% say stock market conditions don’t affect their spending decisions, and ~20-25% are waiting for more stability before making large purchases.
6. Economic pessimism spans demographic segments, but is most pronounced among Asians, Democrats, and females.
Inflation and trade tensions are key concerns. Pessimistic segments are also more likely to cut back on spending across categories relative to neutral/optimistic consumers.